简体中文 · English · Back to notebook
🥽 VR research: use computation where people need it
Keep the details users need, and reuse work shared by several users. My thesis connects eye-task recognition, rendering control, shared caches and client–edge communication into an evaluable system.
| Research work | Approach | Results reported in the thesis |
|---|---|---|
| Task-aware rendering | Task-aware detail and resolution | Mean segment frame time: 10.14 → 5.40 ms |
| Shared cache reuse | Shared blocks and learned scheduling | Mean relative hit-rate gain: 22.08% across six system conditions |
| Integration | Unity client + Python edge service + TCP | Real-headset integration; 30-minute, 60-user simulated load |
Results come from separate thesis experiments, with conditions explained below. Figures are public; code repositories remain private.
The system at a glance: task-aware clients, reusable content at the edge
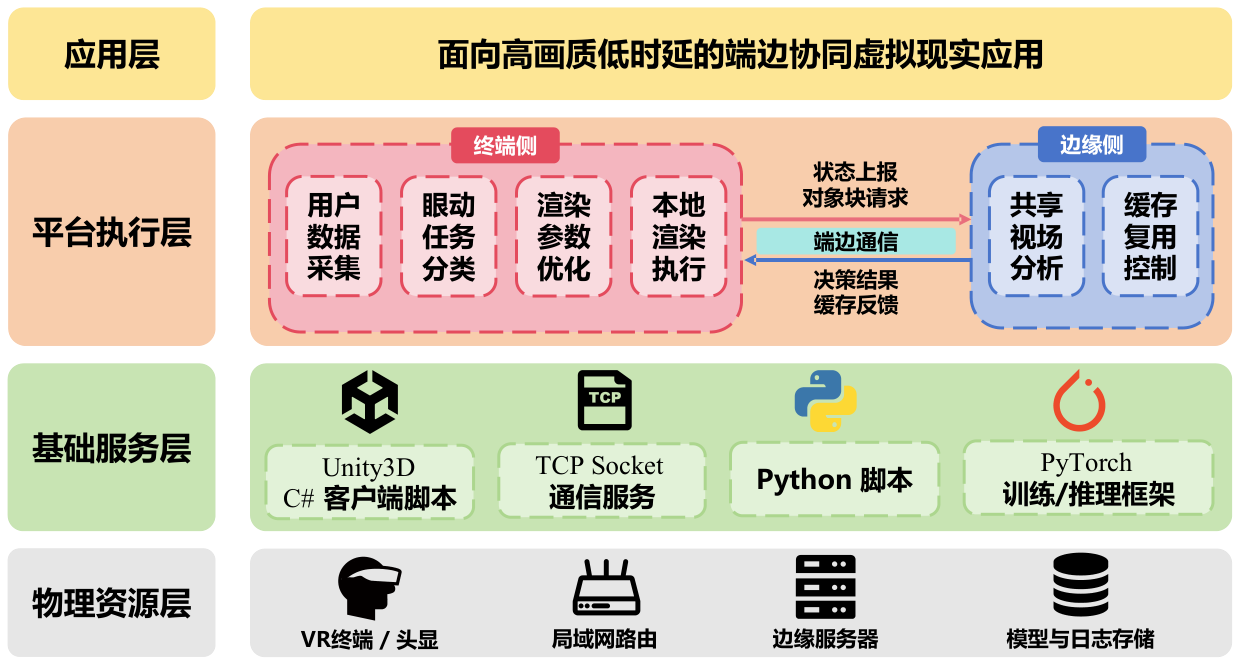
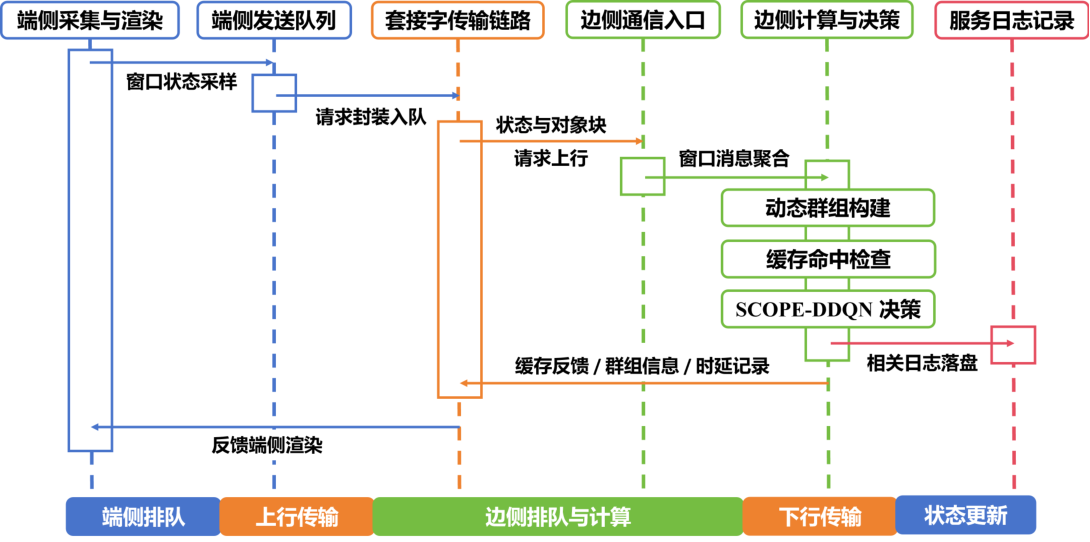
Read the diagram: observe head/eye behavior → recognize the task and adjust rendering → send state and object-block requests to the edge → return cache decisions and results.
① Tasks and quality · ② Sharing and caches · ③ System results · ④ Implementation and figures
| Part | Plain-language question | Work |
|---|---|---|
| Client | Which details matter for the current task? | Head/eye observations, task classification, foveation control |
| Edge | Has another user just needed the same content? | Shared object blocks, grouping, retention, admission, prefetch and eviction |
| Connection | What information must the two sides exchange? | State reports, object requests, decisions and cache feedback |
These are the three stages in thesis Chapters 3–5: evaluate the methods, then integrate them. This page summarizes reported experiments; they were not rerun for this showcase. Original figure labels remain in Chinese.
① The same gaze point can require different rendering settings
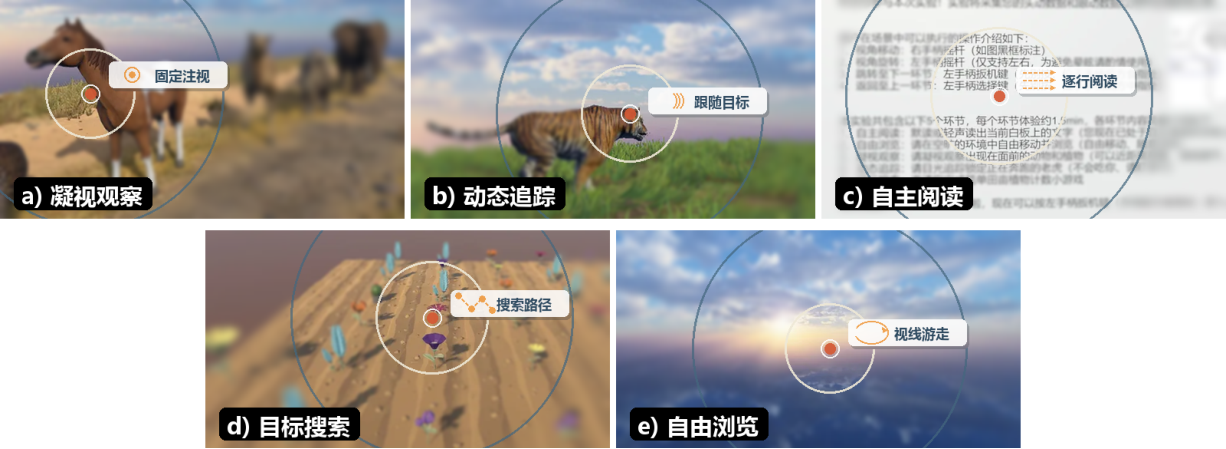
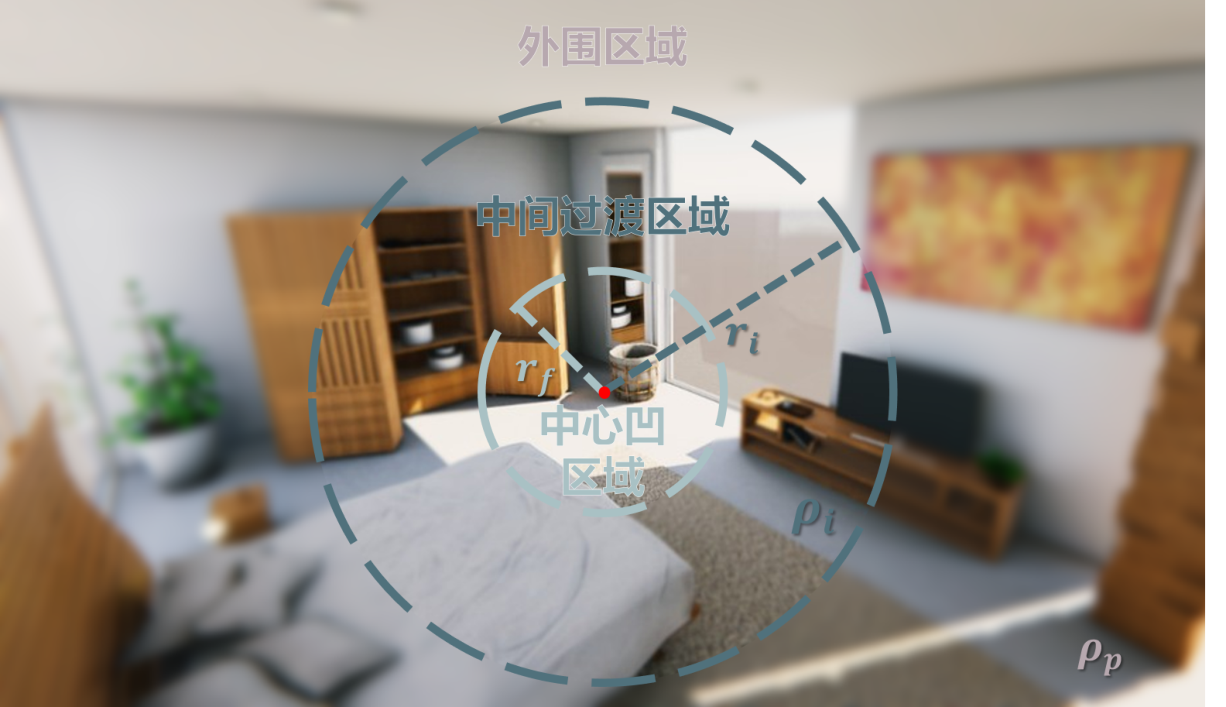
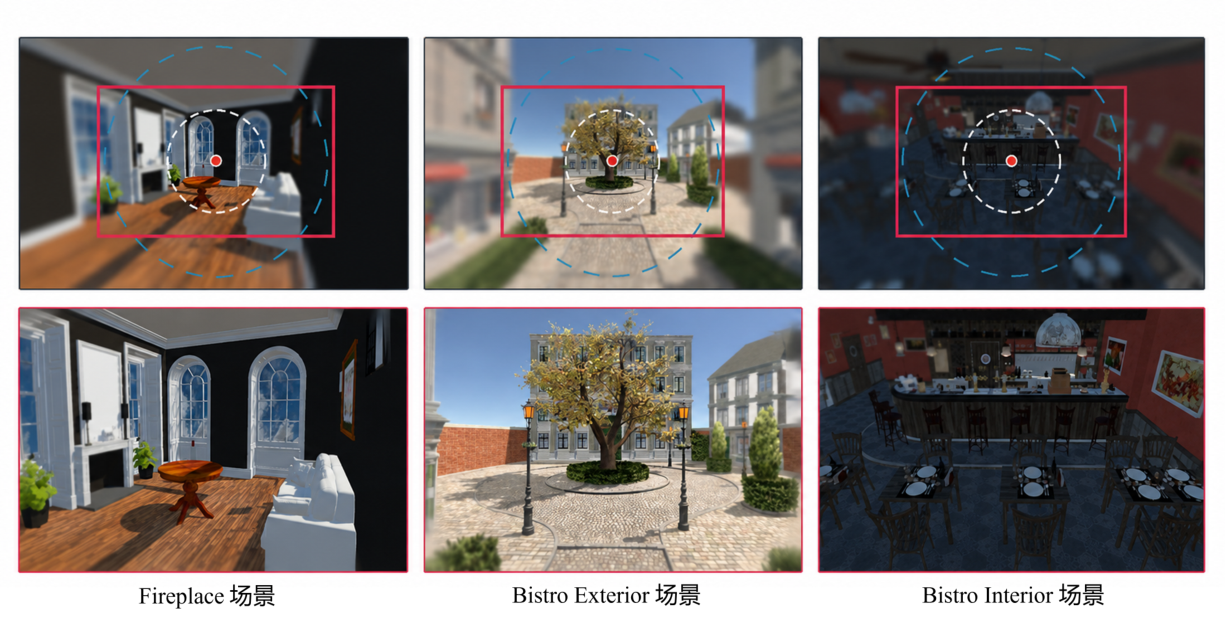
Reading text, tracking a moving object and searching a scene require different detail and coverage. Foveated rendering divides the image into three regions; the task-aware method adjusts their size and resolution using the current task.
| Step | Input and output | Purpose |
|---|---|---|
| Observe behavior | A head/eye sequence | A single gaze point does not describe the whole task |
| Recognize the task | Probabilities for five task types | Distinguish fixation, pursuit, reading, search and browsing |
| Allocate detail | Center/transition size and peripheral resolution | Keep resources where the current task needs them |
| Smooth changes | Continuously adjusted parameters | Reduce abrupt parameter changes |
Evaluate quality and rendering cost together
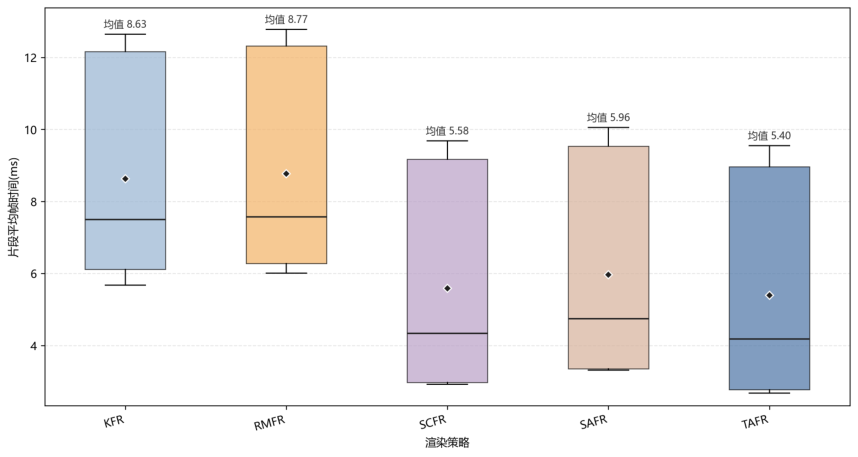
| Strategy | Mean segment frame time | Mean segment over-budget ratio | Speed-up vs full resolution |
|---|---|---|---|
| Full resolution | 10.14 ± 2.99 ms | 33.42% | 1.00× |
| SCFR baseline | 5.58 ± 2.95 ms | 6.09% | 1.82× |
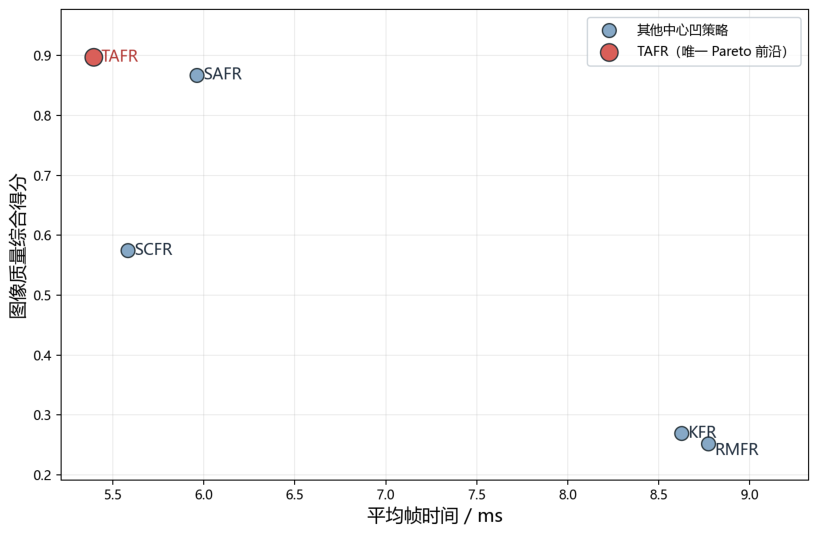
| TAFR task-aware strategy | 5.40 ± 2.97 ms | 4.81% | 1.88× |
Source: final thesis Table 3.7, printed page 48. Compute statistics within scene–route segments, then average across segments. The rendering speed-up does not describe the complete VR system’s end-to-end speed-up.
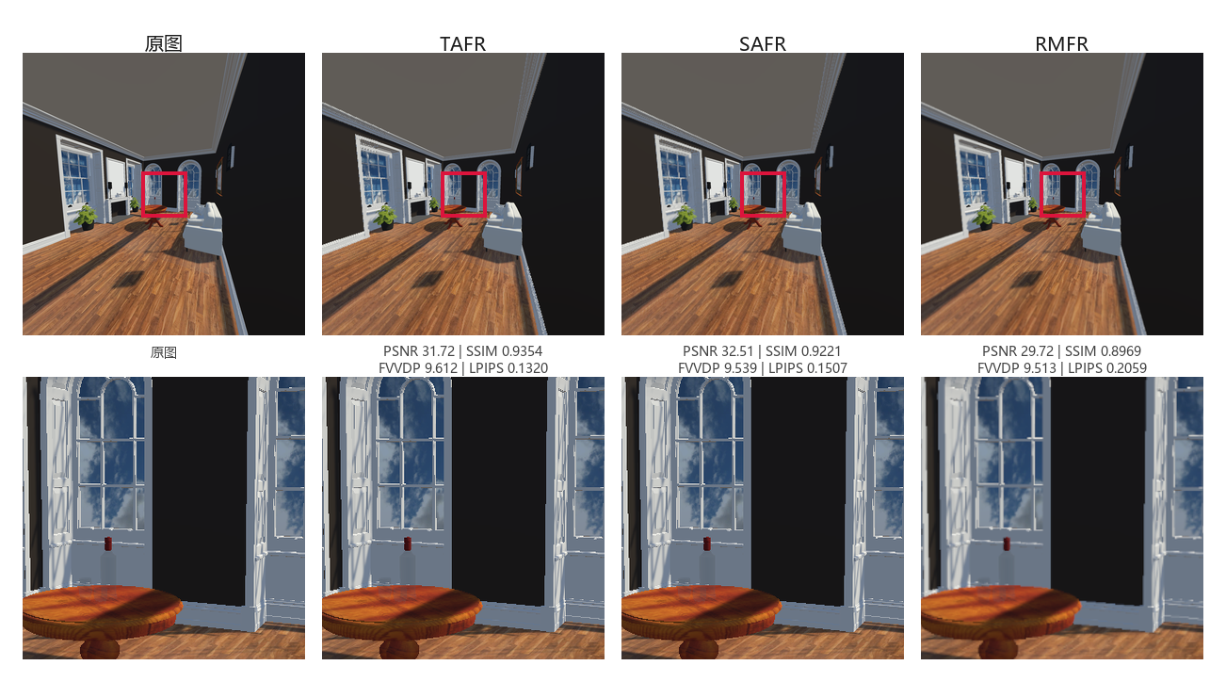
Quality is evaluated with PSNR, SSIM, LPIPS and FovVideoVDP. TAFR performs well on aggregate SSIM and LPIPS, but does not win every metric in every scene. The task classifier reports 93.85 ± 0.26% accuracy in sample-level five-fold cross-validation; this does not establish equivalent accuracy on entirely unseen users.
② What can users with overlapping views share?
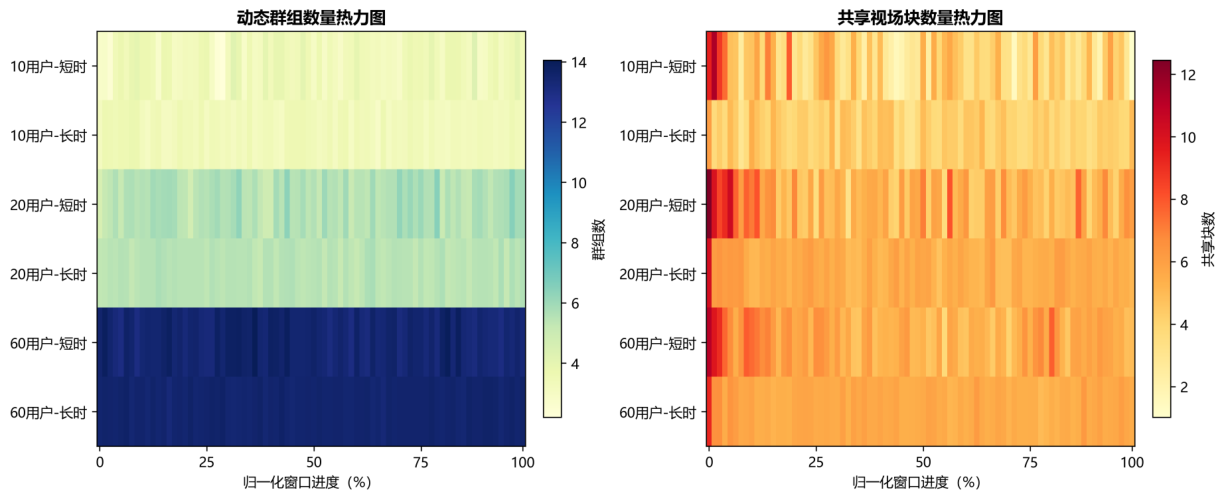
Different positions and orientations can still expose the same object to several users. Object-block representations make overlap measurable, so shared value can inform cache scheduling.
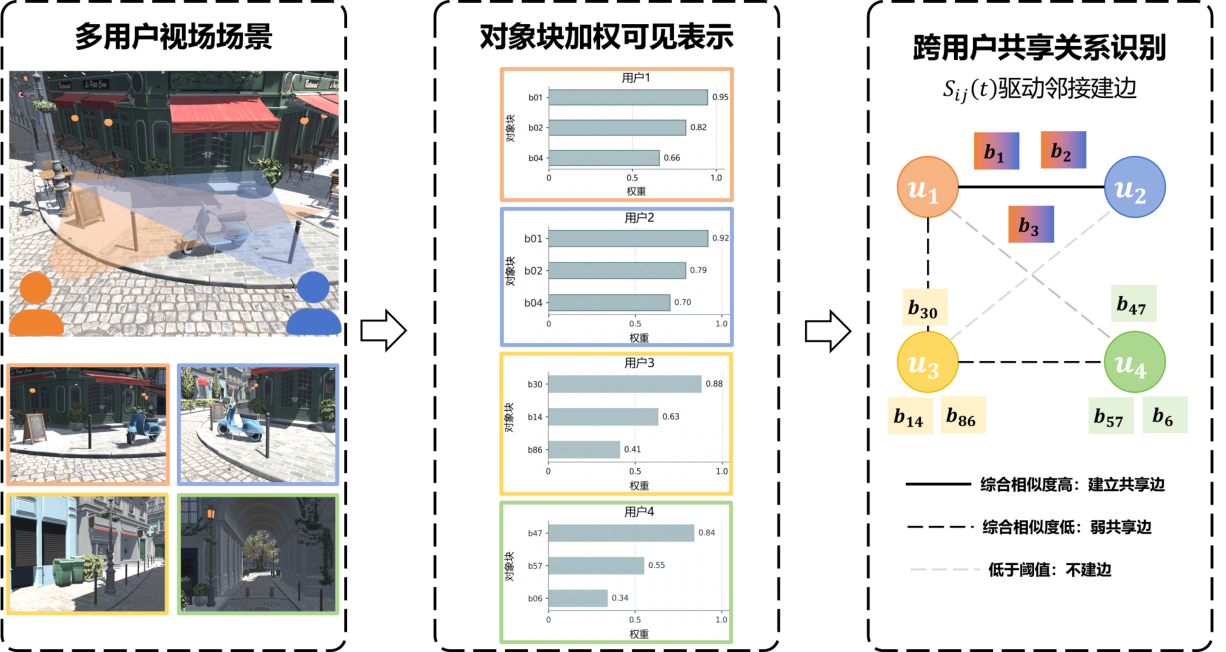
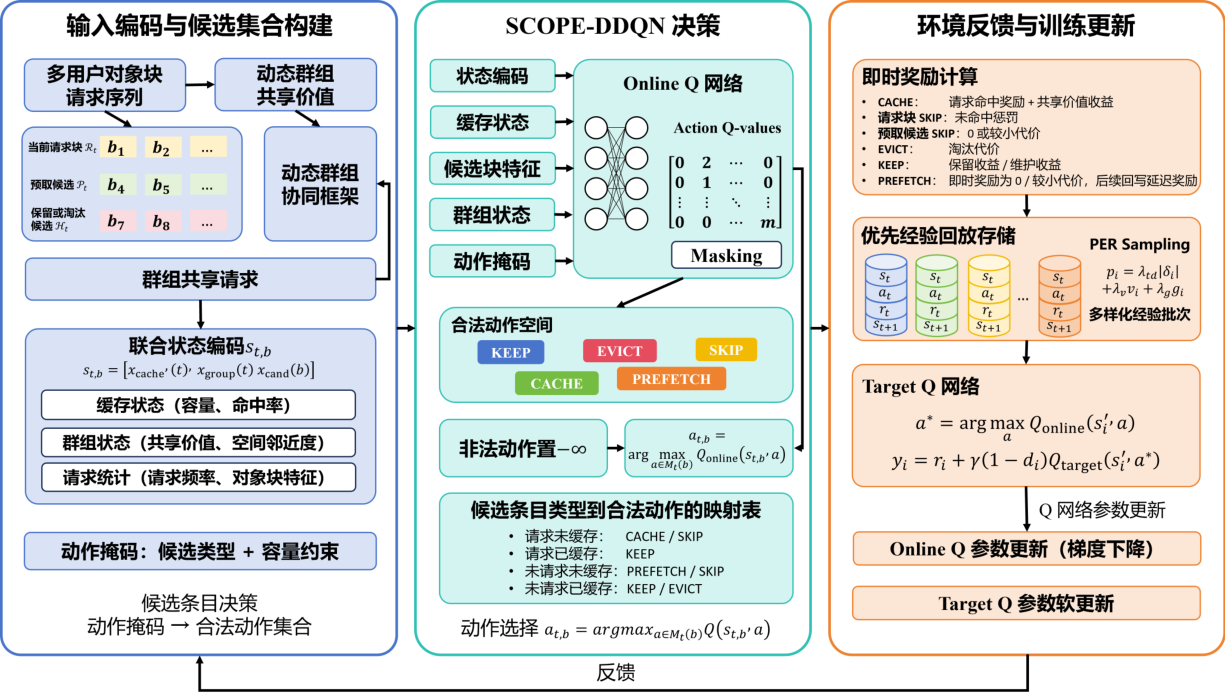
| Cache question | Action |
|---|---|
| Is new content worth storing? | Admission |
| What is likely to be reused by several users? | Retention or prefetch |
| What should leave when capacity is exhausted? | Eviction |
SCOPE-DDQN learns these choices from state and feedback. Compare its benefit against rule-based methods such as LRU, and account for decision overhead and load. Additional algorithm complexity needs measured justification.
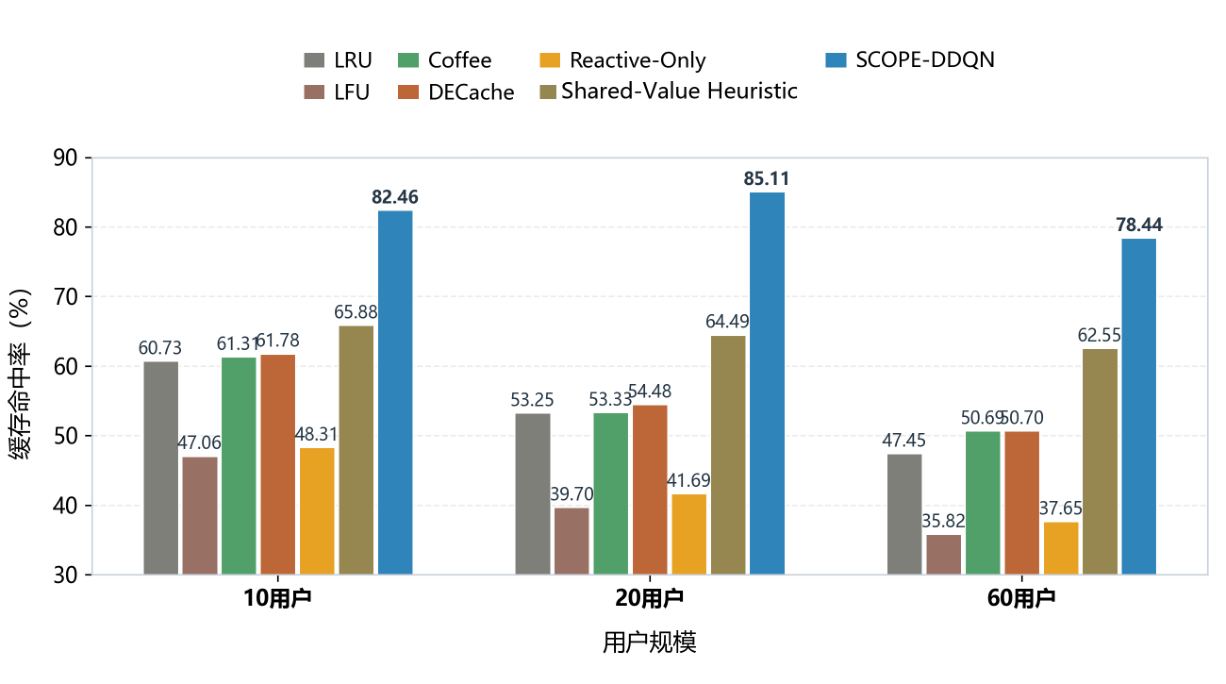
This is a Chapter 4 method experiment. The next section is a Chapter 5 integrated-system experiment. Request workflows and aggregation differ, so the numbers should not be combined into one performance curve.
③ How much benefit remains after integration?
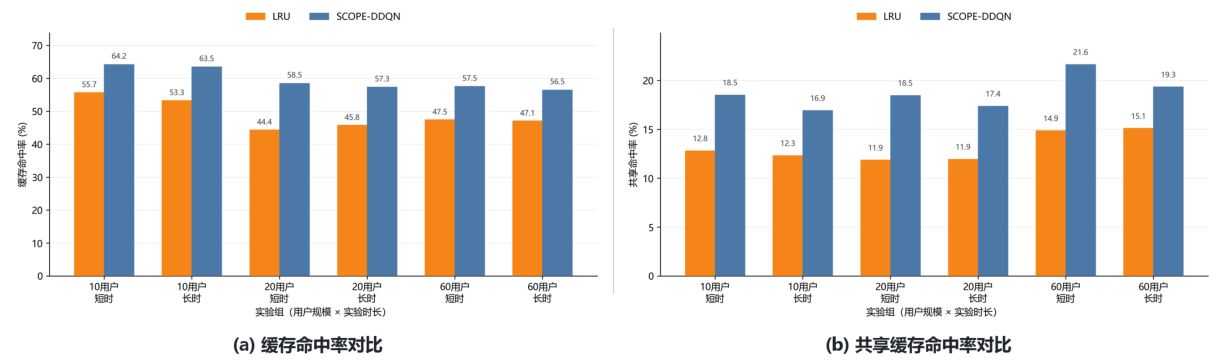
| Users and duration | LRU hit rate | SCOPE-DDQN hit rate | LRU shared hit rate | SCOPE-DDQN shared hit rate |
|---|---|---|---|---|
| 10 · short | 55.72% | 64.22% | 12.80% | 18.51% |
| 10 · long | 53.30% | 63.49% | 12.32% | 16.92% |
| 20 · short | 44.37% | 58.47% | 11.86% | 18.47% |
| 20 · long | 45.79% | 57.34% | 11.94% | 17.37% |
| 60 · short | 47.47% | 57.55% | 14.87% | 21.63% |
| 60 · long | 47.12% | 56.48% | 15.10% | 19.34% |
Source: final thesis Table 5.4, printed page 84. Six paired conditions, two methods, 12 experiment groups. Multi-user requests are generated by a controlled simulation; real-headset integration verifies collection, rendering and communication.
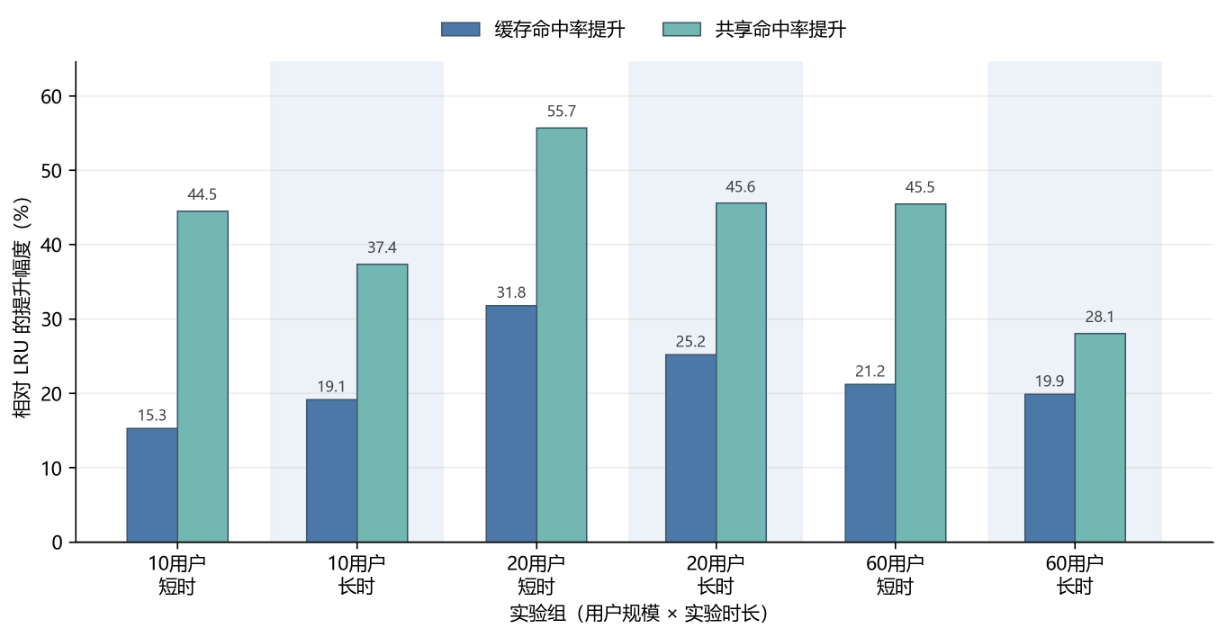
A concrete example: in the 20-user short condition, 44.37% → 58.47% is 14.10 percentage points, or approximately 31.78% relative gain.
| Summary across six paired conditions | Mean relative gain | Bootstrap 95% confidence interval |
|---|---|---|
| Cache hit rate | 22.08% | [18.31%, 26.51%] |
| Shared hit rate | 42.78% | [35.46%, 49.23%] |
Source: final thesis Table 5.5, printed page 85. These are means of condition-wise relative gains, not mean percentage-point differences.
Observe a longer run
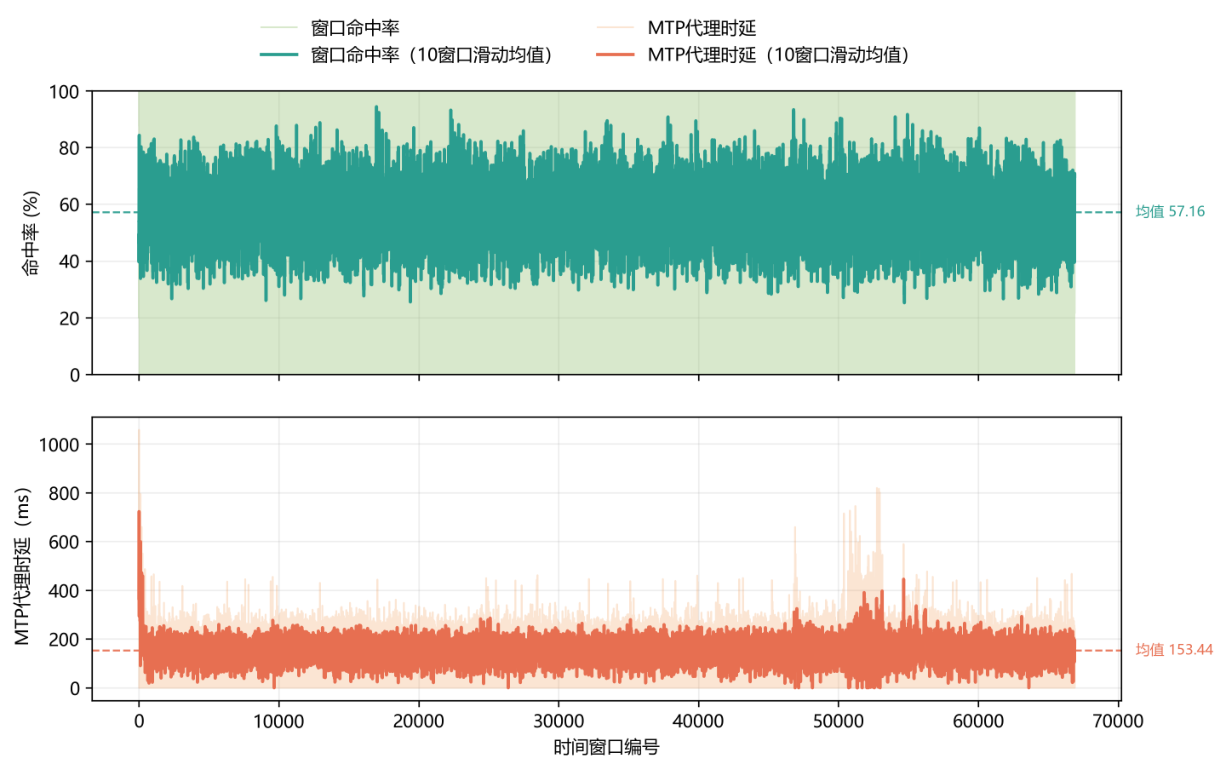
The window-level mean hit rate is 57.16%, with approximately 153.44 ms mean edge-processing proxy latency. This proxy measures server-side handling from request receipt to response creation. It is not network round-trip latency or headset end-to-end Motion-to-Photon latency. Window-level and whole-run hit-rate aggregation can differ.
④ Implementation and more original figures
| Part | Technologies and work |
|---|---|
| Client and scenes | Unity 2022.3 LTS, C#, Pico 4 Enterprise integration, task-driven rendering parameters |
| Edge cache | Python 3.10, PyTorch 2.1, dynamic grouping, shared object blocks, cache decisions |
| Communication | TCP sockets, structured JSON, state reports and feedback |
| Evaluation | Baselines, ablations, integrated-system comparisons, 30-minute runs |
Expand communication, runtime examples and additional results
Exchanging state between client and edge
Rendering settings during execution
Shared opportunities as user groups change
Organizing cache decisions
Inspecting rendering cost and quality together
Relative gains across six system conditions
What the evidence supports, and what remains to evaluate
| Supported by current experiments | Further evaluation needed |
|---|---|
| Task recognition, rendering control and shared caching form a working chain | Different devices, scenes and real users |
| Method and system experiments report quality, cost and cache benefits | Cross-user generalization and decision overhead |
| Controlled multi-user loads permit cache and long-run comparisons | Large real-user deployments, wireless variability and end-to-end experience |
The work connects measurable modules and evaluates the resulting system, with separate definitions for each benefit and cost.
Original figure provenance and page numbers · Discuss via GitHub Issues